
Lyft Bike
Course: Bentley University, Managing with Analytics, Team Assignment using Tableau
My Main Contribution: Writing the Findings & Ideas section, Visual Design (The other team mates did more of the data cleaning & manipulation with Python, R and Custom Scripts.)
Introduction
Many commuters in San Francisco ride bikes to work. Since acquiring bike-sharing companies, Lyft has also won exclusive rights to rent docked and dockless bikes in San Francisco. Analyzing Lyft’s bike-sharing data from the San Francisco Bay Area, we hope to identify usage patterns and provide recommendations that might help the company optimize business operations and develop marketing strategies.
Methodology
This visualization-based analysis is primarily derived from a Bay Area Bike Sharing Trips dataset found on the data-sharing platform Kaggle. A set of secondary data from the National Weather Service Forecast Office was utilized and organized to strengthen the conclusions derived. The project team used Python, R, and custom Excel scripts to do the initial data cleaning. Additionally, we separated the original data into smaller data source files, limited the number of variables, and created all derivative variables using Tableau custom formulas and parameters. Considering the large amount of transaction data in the main data source, we used only two months’ worth of data, namely January and July, to represent the two main seasons in the Bay Area. We also did data transformations, such as data joins, custom calculated fields, and dynamic filtering, using Tableau build-in functions, custom formulas, and parameters. Lastly, all colors of the figures were edited in Adobe Illustrator to fit the Lyft brand. All data used are anonymized data that does not contain user-specific information such as age, gender, or ZIP codes.
Findings: Plausible Factors Affecting Ridership
According to Lyft’s pricing structure, there are options for single trips or monthly/annual membership. In the following sections, members are referred to as ‘Subscribers’ and the others as ‘Non-Subscribers’.
1. Days in the week
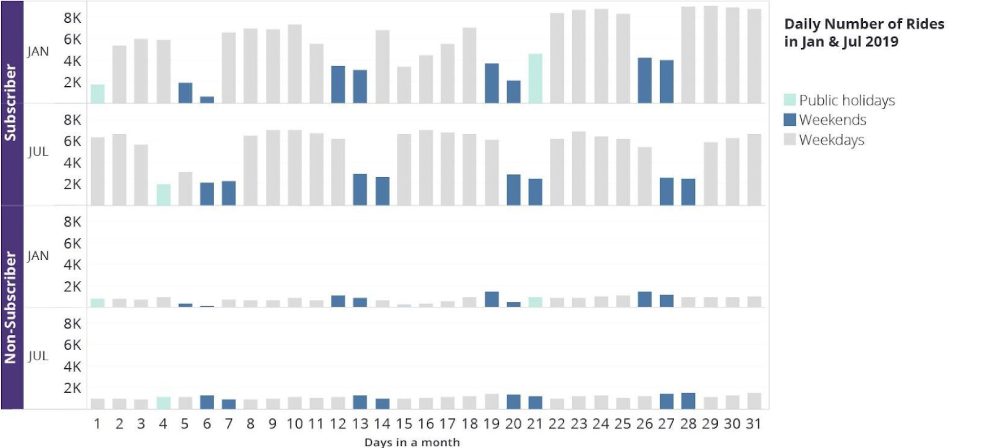
Weekends and Public Holidays: In Figure 1, rows 1 and 2 show that subscribers seem to ride less on days that are either weekends or public holidays. Interestingly, on 5 July 2019, though it was neither a public holiday nor a weekend, it was a Friday between a holiday and a weekend. This might perhaps account for its lower ridership compared to the other Fridays. For non-subscribers, public holidays and weekends do not have the same effect as they have for subscribers. Instead, the number of rides tends to peak weekly towards the weekends for non-subscribers. Of the eight weekends recorded, five Saturdays, two Fridays, and one Sunday had the highest number of rides for the week for non-subscribers.
General weekly arc in January versus July: From the graphs, ridership for non-subscribers (rows 3 and 4) seems to form a subtle weekly repeated pattern, which peaks mostly on the weekends. Ridership for subscribers seems to have a consistent weekly pattern only in July but not in January. This might be due to other factors like weather, which seems more consistent in July than January.
2. Weather
As there is hardly any recorded precipitation in July, Figure 2 shows the weather data only for January, aligned with the combined daily total number of rides. Average temperatures do not vary too much within a month in California. Hence, the report will focus more on precipitation and wind speed.
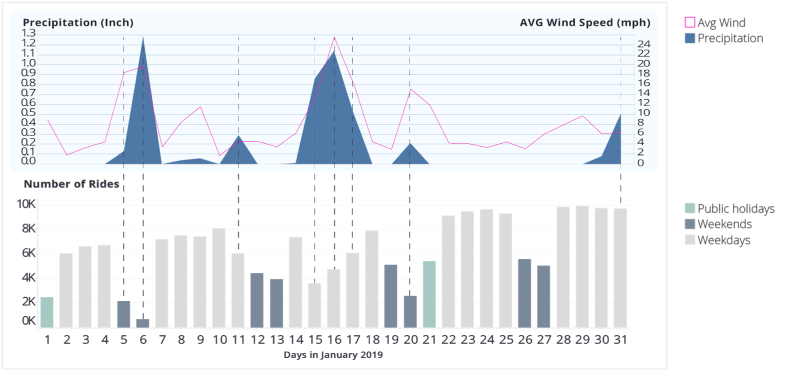
From Figure 2, the number of rides was reduced when there were both relatively higher precipitation and higher wind speeds. This can be seen on the first weekend (5 and 6 January) and the third mid-week (15-17 January). Both periods had fewer rides than other similar weekdays or weekends in the same month. However, other than having both heavy precipitation and strong breezes together, the effects of weather were otherwise inconsistent. For example, 31 Jan had more rain and breeze than 11 Jan, but it had more rides than 11 Jan, even though both are weekdays and non-public holidays. This might be because these are comparisons between entire days. Some heavier rains may have lasted over only a shorter period, or the rains may have occurred overnight. On a side note, there were also more rides in total in July than in January. Though it might be due to generally higher temperatures, it might also be due to other season-relevant factors like the summer school holidays. Another note is that fog may have affected ridership, but past fog data was not found and included in this analysis.
3. Time of Day
The following figures show the number of rides by the hour. For discussion, the day is divided into four 6-hour time slots starting from midnight (Early Morning, Morning, Afternoon, and Night).
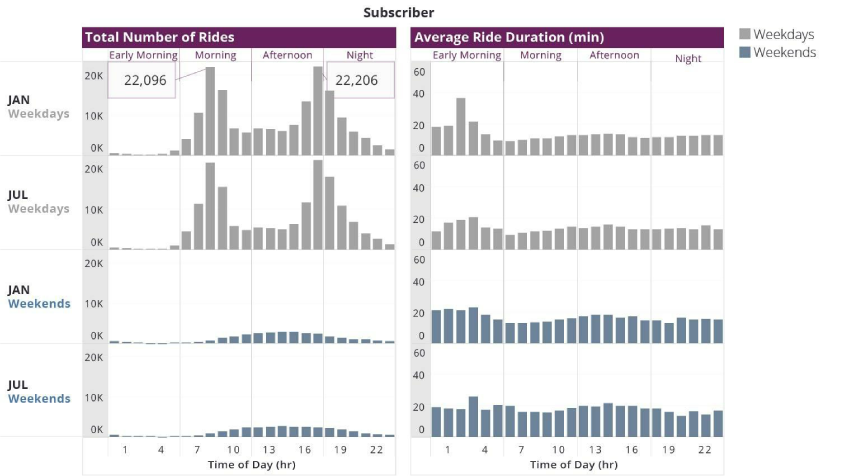
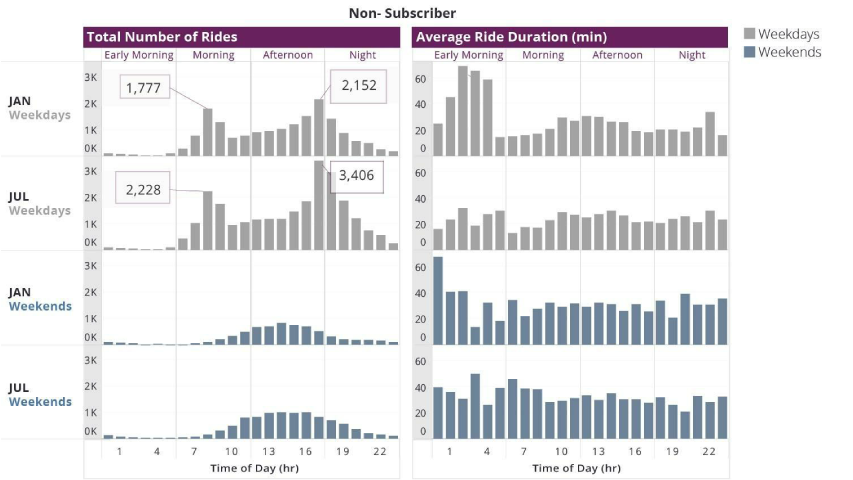
Both figures above illustrate the ridership patterns over the course of the days. While there are no drastic differences in patterns between January and July (rows 1 vs. 2 and rows 3 vs. 4, in both figures), there are different patterns for weekdays vs. weekends. On the weekdays, the two daily peaks in the number of rides can be seen in the mid-morning and late afternoon or evening. They are probably fueled by the worker’s commute. For the weekends, the number of rides tends to increase from mid-morning towards mid-afternoon and slowly become lesser towards night.
Imbalanced Peak Demands: An interesting note is that for non-subscribers, there is an imbalance between the morning peak and that of the evening peak. For example, in July (Figure 4, row 2), the number of rides between 5 pm and 6 pm is approximately 1.5 higher than the morning peak records from 8 to 9 am. Perhaps some of these users rely on other transport options for their morning commute and opt for renting a bike for their evening commute when there is less of a hurry to reach their destinations. There is also a slight imbalance for subscribers, though it is much more so in July. This is probably due to July’s longer summer hours than in January.
Long Night Rides: There is also an interesting tendency in the average duration of night rides in January. Especially for non-subscribers in Figure 4, row 1, their average bike duration could be above an hour on weekday mornings between 1 and 4 am. We suppose the longer night rides are likely due to trains and buses stopping around midnight. Nightriders may opt for the affordable bike-sharing service ($8 for the first hour) instead of the high taxi/car-sharing night rates. However, it would be interesting to find out why it happened only in January and not July.
Subscriber versus Non-subscriber: It also seems that the average ride duration is slightly greater for a non-subscriber than for a subscriber. Additionally, the average duration figures generally differ more from hour to the next hour for non-subscribers.
Ideas to Explore
To increase ridership, here are some initial ideas requiring further research and study.
1. Consider giving distance-based promotions, especially during off-peak hours. This might be beneficial if Lyft were to look into having more hybrid bikes in the future, where distances might be less limited by docking stations. Looking at Figure 3, we can see that subscribers usually do not ride more than the free 45 minutes per ride, as they would incur additional costs afterward. Non-subscribers also have to pay more after the 30-minute mark. While still charging by duration, distance-based promotions and discounts may encourage longer ride durations. While more proof of concept is needed, one potential extension of this idea is to perhaps leverage the healthy benefits of exercise by working with health-related organizations. For example, Lyft can provide a discount for a gym membership if the customers can cycle for more than 5 miles in one session. Another example of this angle on healthy diets and lifestyles could be providing discounts for healthy snacks or thirst-quenching drinks after a rider completes certain distances.
2. Optimize low-rider periods such as weekends via real-time location tracking. If the user’s mobile phone location is accessible, Lyft could provide promotional discount codes to users who are already near stations that are currently undergoing low-rider periods. These location-based discounts could also be applied to the rides that have an end destination near popular docking stations near the start of peak hours. In this way, Lyft could encourage users to help move bikes to the popular docking stations. Especially relevant to hybrid bikes, which may not be left docked in stations, Lyft could optimize the operational costs of returning bikes to meet demand on time.
3. Since bad weather conditions might reduce ridership for a location, Lyft could also explore offering windproof ponchos (with Lyft-branded designs) dispensed through vending machines. This is to encourage ridership when there is less-than-optimal weather.

